颗粒化脱细胞真皮基质(phADM)注射作为皮肤修复型 booster 的临床与临床前整合研究:一项分脸、随机、双盲临床试验
2026年10月26日56 min read
International Journal of Molecular Sciences
International Journal of Molecular Sciences
结论与实践要点
本研究为一项随机、分脸、双盲的前瞻性临床试验,在韩国首尔Severance医院纳入20例轻中度面颊粗糙(ACSS 2–3)的成人(平均54.7岁,13例女性;2024年11月至2025年5月,注册号NCT07155278)。每例受试者一侧注射颗粒化脱细胞真皮基质(phADM,Elravie Re2O),对侧以非交联透明质酸(HA)皮肤booster为对照,均经自动化注射装置注入真皮中层,每侧1.5 mL,随访20周。结果显示,phADM侧在皮肤密度、体积、弹性、皱纹深度、毛孔面积、水合与屏障功能(TEWL)等多项客观指标上,自第8周起(部分参数更早)的改善均显著优于HA对照(组间p<0.05);其中TEWL在第8与第20周、水合自第8周起、毛孔面积自第12周起、弹性在第4与第20周的差异尤为显著。主观评价上,研究者与受试者GAIS自第8至20周均显著高于对照(p<0.05),ACSS在phADM侧各时点均较基线显著下降(p<0.05)而对照侧几无变化。
临床安全性良好,研究期间未出现严重不良事件,仅见短暂红斑与轻度肿胀并自行消退。为阐释临床获益的机制,研究整合了离体人皮、体外细胞与大鼠在体三类临床前实验:离体人皮显示phADM真皮内均匀分布并保留细胞外基质结构,且在UVB光老化模型中恢复基底膜相关蛋白(nidogen I、IV型胶原,p<0.05);体外实验提示phADM可促进人真皮成纤维细胞增殖及胶原I/III、弹性蛋白与血管生成因子合成,上调角质形成细胞透明质酸合成,并剂量依赖性地抑制脂多糖活化的小鼠巨噬细胞的炎症因子(IL-1β、TNF-α、IL-6、PGE-2);大鼠皮下注射1周可见成纤维细胞浸润及基质-宿主界面的新生胶原。需特别说明,上述离体、体外与大鼠在体(in vitro/ex vivo/动物)研究部分为非在体研究,其结论不能直接外推至人体临床,仅可作为作用机制的辅助证据,人体有效性仍以本试验临床数据为准。
本研究存在若干局限:样本量较小(n=20)且采用分脸设计,外部推广泛化受限;20周随访不足以评估长期持久度与迟发不良事件;试验品为phADM与非交联HA载体的混合物,二者协同效应难以完全分离;同时评估的终点与时间点较多,存在多重比较导致Ⅰ类错误的风险,部分显著性发现应谨慎解读,尚需更大样本、充分把握度的研究加以验证。
Injectable skin boosters currently in use mainly provide short-lived volumization or depend on inflammation-mediated collagen stimulation, raising concerns regarding durability and safety. Injectable particulate human acellular dermal matrix (phADM) is a biologically derived extracellular matrix scaffold designed to support constructive dermis remodeling. This randomized, split-face, double-blinded clinical trial evaluated the efficacy of phADM as a facial skin booster in 20 adults with moderate cheek roughness. phADM was injected on one facial side, with hyaluronic acid serving as the contralateral control. Multiple skin parameters were assessed over 20 weeks using validated imaging and biophysical instruments. Mechanistic validation was conducted using complementary in vitro, ex vivo human skin, and in vivo rat models. Clinically, the phADM-treated side demonstrated greater improvements in skin density, volume, elasticity, wrinkle depth, pore area, hydration, and barrier-related parameters at multiple time points compared with HA. In ex vivo human skin, phADM showed homogeneous dermal distribution and preservation of extracellular matrix architecture, along with restoration of basement membrane-associated proteins following UVB irradiation. In vivo rat studies revealed fibroblast infiltration and localized neocollagenesis within the implanted matrix. In vitro assays further indicated enhanced fibroblast proliferation and extracellular matrix synthesis, increased hyaluronan production, suppression of pro-inflammatory cytokines in activated macrophages, and downregulation of melanogenesis-related genes in melanoma cells. No serious adverse events were observed during the clinical study. These findings indicate that phADM functions as a restorative skin booster that promotes durable dermis remodeling and functional rejuvenation with a favorable safety profile.
Keywords: acellular dermal matrix、dermal fillers、skin boosters、skin aging、extracellular matrix、regenerative medicine
Currently, the landscape of non-surgical facial rejuvenation is dominated by skin boosters, defined as bioactive materials injected into the skin to promote its functions, and restore and maintain its structure. Most commonly used skin boosters include hyaluronic acid (HA), polynucleotides, and synthetic collagen stimulators [ 1 , 2 ]. HA fillers primarily offer volumetric augmentation and hydration with low biostimulation, while synthetic stimulators [e.g., poly-L-lactic acid (PLLA), calcium hydroxyapatite (CaHA)] induce prolonged collagen production through an inflammatory foreign body reaction [ 3 , 4 , 5 , 6 , 7 ]. However, neither approach fully recapitulates the natural skin environment. Moreover, these synthetic stimulators are associated with inherent safety concerns, including the risk of foreign body granulomas and delayed-type hypersensitivity reactions [ 8 , 9 , 10 , 11 ]. These limitations highlight the unmet need for next-generation skin boosters that deliver fundamental skin improvement through biocompatible regenerative mechanisms while avoiding the safety liabilities associated with synthetic materials.
In this context, human acellular dermal matrix (hADM) represents an important advance in restorative medicine as a biologically derived scaffold that preserves native extracellular matrix (ECM) architecture while removing cellular components to reduce immunogenicity and the risk of immune rejection [ 12 ]. As a homologous biomaterial derived from human tissue, hADM retains the ultrastructural organization of the dermis, including collagen, elastin, and glycosaminoglycans, thereby conferring mechanical stiffness and elastic properties that closely approximate those of native human skin [ 13 , 14 ]. Upon implantation into the skin, hADM promotes vascularization, host cell infiltration, and incorporation into the tissues within 3–6 months, thereby enhancing production of ECM components (e.g., collagen and elastin) while preserving its long-term structural integrity [ 13 , 15 ]. While hADM has traditionally been used in sheet forms for reconstructive surgery [ 16 , 17 , 18 , 19 ], its evolution into a micronized/particulated, injectable form has opened new frontiers in aesthetic dermatology [ 17 , 20 , 21 ]. However, clinical studies investigating injectable hADM as a primary dermal scaffold for tissue restoration and homeostatic skin remodeling are still absent.
To address this knowledge gap, we designed this study as a randomized, split-face, double-blinded, prospective clinical trial to evaluate the effectiveness and safety of phADM when utilized as a skin booster. Furthermore, to substantiate the clinical outcomes and clarify underlying mechanisms, we conducted integrated in vitro, ex vivo, and in vivo studies examining dermis structural remodeling, skin barrier restoration, and regulation of inflammatory and pigmentation pathways. Collectively, these investigations provide a scientific basis for evaluating the therapeutic potential of phADM in skin restoration.
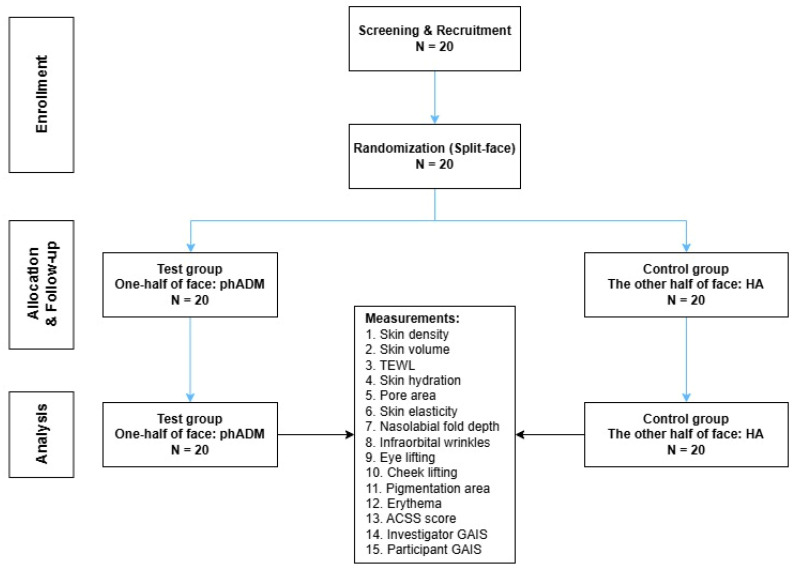
Overall, 20 subjects were recruited for the study. The mean age was 54.7 ± 9.246 years, with 13 of the 20 participants being female ( Table 1 ). There were no significant differences in Allergan Cheek Smoothness Scale (ACSS) scores between the control and test sides of participants’ faces ( p = 0.999). The process of screening, recruitment, randomization, and follow-up is depicted in Figure 1 .
Table 1 Baseline characteristics of participants.
| Characteristics | Values |
|---|---|
| Age (Mean ± SD) | 54.7 ± 9.246 |
| Gender | |
| Female | 13 |
| Male | 7 |
| ACSS score (Mean ± SD) | |
| Test group | 2.9 ± 0.3 |
| Control group | 2.9 ± 0.3 |
| p -value 1 | 0.999 |
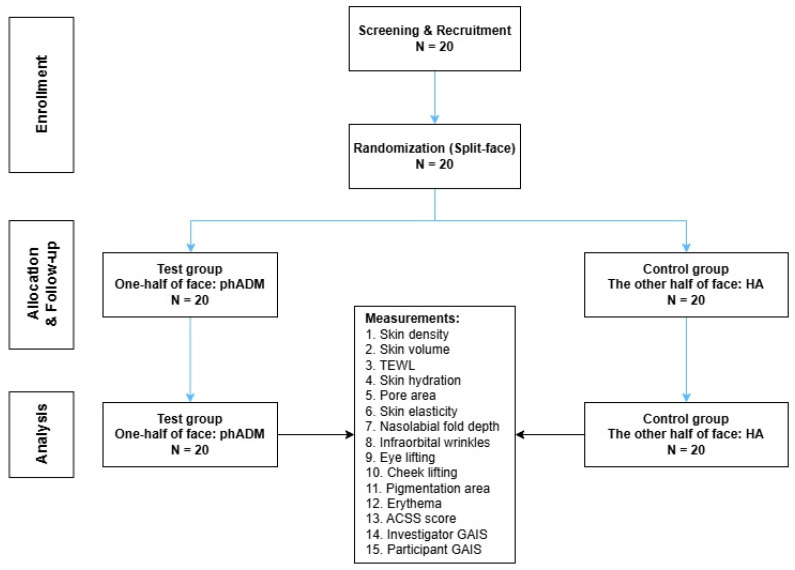
Figure 1 Flowchart of the Screening, Recruitment, Randomization, and Follow-up process of the study. phADM, particulated human Acellular Dermal Matrix; HA, hyaluronic acid; TEWL, transepidermal water loss; ACSS, Allergan Cheek Smoothness Scale; GAIS, Global Aesthetic Improvement Scale.
The longitudinal changes in skin density for both treatment groups are visualized in Figure 2 A. Quantitatively, while both groups demonstrated statistically significant improvements from baseline at week 20, the magnitude of improvement in the test group was significantly greater ( p < 0.05; Figure 2 B, Table 2 ). Figure 2 C illustrates the changes in skin volume for both groups over the 20-week period. Quantitative analysis revealed that the test group showed a marked increase from baseline after 20 weeks, whereas the control group exhibited minimal changes ( Figure 2 D). Consequently, the test group demonstrated superior volumetric enhancement compared to the control group at all-time points ( p < 0.05; Figure 2 D, Table 2 ).
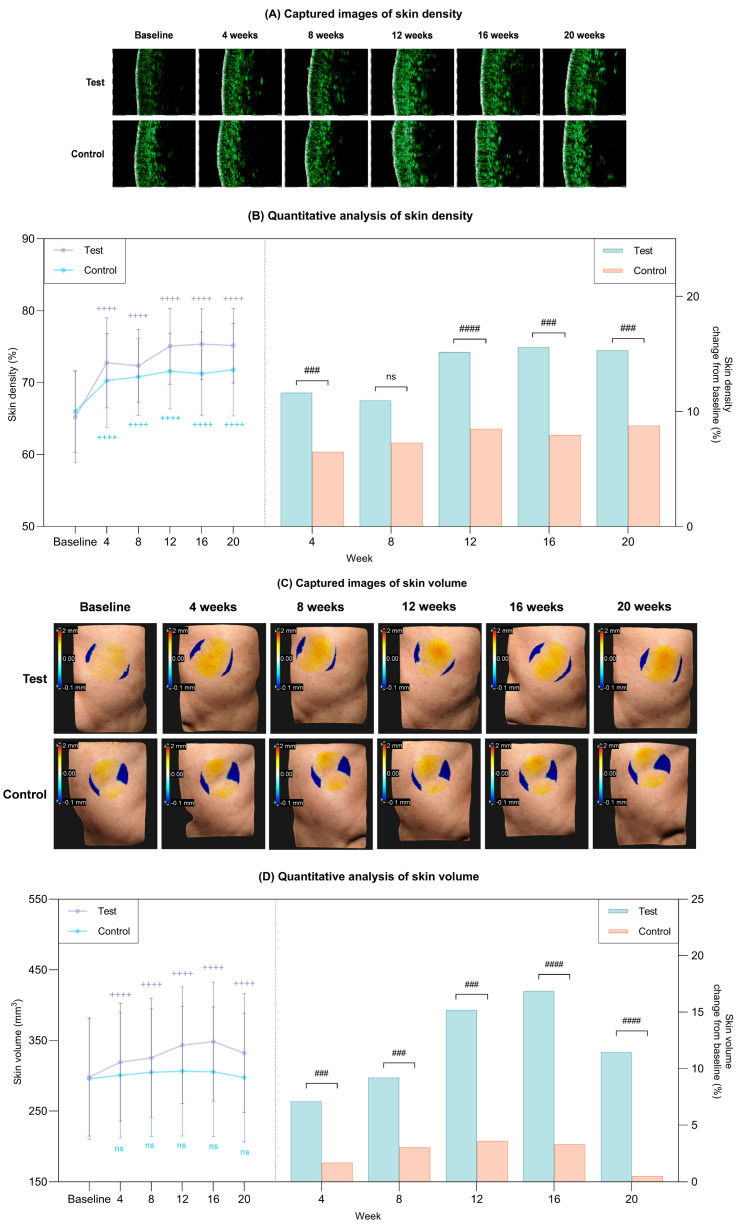
Figure 2 Clinical improvements in skin density and volume after 20 weeks of treatment in the test and control groups. (A) Captured images of skin density via Skin Scanner. (B) Quantitative measurement of skin density (left) and percent change from baseline (right) in each group. (C) Captured images of skin volume via 3D LifeViz micro. (D) Quantitative measurement of skin volume (left) and percent change from baseline (right) in each group. Data are presented as mean ± SD. + comparison to baseline within groups, ++++ p < 0.001. # comparison of change from baseline between groups at each time point, ### p < 0.005, #### p < 0.001. ns, not significant.20周时皮肤密度与体积的临床改善:两组均较基线显著提升,但phADM侧(试验组)的改善幅度显著大于HA对照侧(组间p<0.05)。Table 2 Evaluation of skin parameters.
| Group | Baseline | 4 Weeks | 8 Weeks | 12 Weeks | 16 Weeks | 20 Weeks |
|---|---|---|---|---|---|---|
| Skin density (%) | ||||||
| Test | 65.185 ± 6.316 | 72.763 ± 6.265 b,d | 72.333 ± 5.042 b | 75.063 ± 5.272 b,d | 75.355 ± 4.926 b,d | 75.154 ± 5.189 b,d |
| Control | 65.998 ± 5.680 | 70.281 ± 6.544 b | 70.809 ± 5.342 b | 71.601 ± 5.254 b | 71.255 ± 5.781 b | 71.789 ± 6.423 b |
| Skin volume (mm 3 ) | ||||||
| Test | 298.028 ± 83.400 | 319.202 ± 83.400 b,d | 325.484 ± 84.122 b,d | 343.356 ± 82.662 b,d | 348.330 ± 84.157 b,d | 332.205 ± 83.778 b,d |
| Control | 295.788 ± 85.941 | 300.842 ± 88.499 | 304.840 ± 90.700 | 306.476 ± 91.925 | 305.642 ± 91.962 | 297.300 ± 91.016 |
| TEWL (g/m 2 /h) | ||||||
| Test | 14.682 ± 3.294 | 13.895 ± 2.873 | 13.010 ± 2.621 b,c | 13.190 ± 2.947 b | 13.877 ± 3.358 a | 13.092 ± 2.625 b,c |
| Control | 14.950 ± 2.615 | 14.622 ± 2.910 | 13.985 ± 2.358 | 14.138 ± 2.594 | 14.392 ± 2.533 | 14.482 ± 2.831 |
| Skin hydration (grey index) | ||||||
| Test | 114.345 ± 21.678 | 132.238 ± 18.236 b | 136.286 ± 16.248 b,c | 140.037 ± 17.909 b,c | 139.614 ± 15.573 b,d | 138.869 ± 14.275 b,d |
| Control | 117.206 ± 21.243 | 128.500 ± 17.340 a | 131.088 ± 16.710 b | 134.869 ± 16.718 b | 132.682 ± 16.528 b | 133.737 ± 13.324 b |
| Pore area (mm 2 ) | ||||||
| Test | 61.985 ± 28.812 | 51.034 ± 23.784 b | 45.888 ± 29.849 b | 44.944 ± 28.865 b,c | 42.756 ± 26.464 b,d | 41.908 ± 28.787 b,c |
| Control | 58.311 ± 28.865 | 50.175 ± 25.713 b | 48.660 ± 26.619 b | 48.468 ± 25.404 b | 49.763 ± 26.379 b | 48.574 ± 25.598 b |
| Skin elasticity (R2) | ||||||
| Test | 0.586 ± 0.074 | 0.643 ± 0.075 b,c | 0.633 ± 0.065 b | 0.639 ± 0.070 b | 0.641 ± 0.059 b | 0.651 ± 0.071 b,c |
| Control | 0.598 ± 0.060 | 0.635 ± 0.061 b | 0.633 ± 0.052 b | 0.634 ± 0.047 b | 0.643 ± 0.046 b | 0.642 ± 0.048 b |
| Nasolabial fold depth (mm) | ||||||
| Test | 0.169 ± 0.071 | 0.160 ± 0.065 b,d | 0.156 ± 0.063 b,d | 0.153 ± 0.063 b,d | 0.149 ± 0.061 b,c | 0.146 ± 0.060 b,c |
| Control | 0.159 ± 0.044 | 0.154 ± 0.042 b | 0.152 ± 0.042 | 0.149 ± 0.042 b | 0.146 ± 0.042 b | 0.143 ± 0.040 b |
| Infraorbital wrinkles (pixels) | ||||||
| Test | 2838.900 ± 1362.696 | 2461.500 ± 1177.704 b | 2325.900 ± 1082.646 b,c | 2254.050 ± 1045.049 b,d | 2154.000 ± 889.961 b,d | 2238.050 ± 897.905 b,d |
| Control | 2805.050 ± 1251.803 | 2482.200 ± 1165.511 b | 2480.050 ± 1182.191 b | 2440.300 ± 979.397 b | 2438.050 ± 1044.166 b | 2504.600 ± 1102.412 b |
| Eye lifting (mm) | ||||||
| Test | 120.705 ± 5.909 | 121.635 ± 6.194 b,c | 121.705 ± 5.911 b,d | 122.120 ± 5.427 b,c | 122.640 ± 5.677 b,d | 122.890 ± 5.611 b,d |
| Control | 120.230 ± 6.270 | 120.805 ± 6.598 | 120.505 ± 6.116 | 120.710 ± 6.368 | 120.825 ± 6.437 | 120.890 ± 6.674 |
| Cheek lifting (mm) | ||||||
| Test | 44.651 ± 7.878 | 45.275 ± 8.004 b | 45.276 ± 8.164 b | 45.117 ± 8.075 b,c | 45.106 ± 8.085 b,d | 45.476 ± 7.986 b,d |
| Control | 41.269 ± 8.479 | 41.700 ± 8.474 b | 41.626 ± 8.493 b | 41.423 ± 8.563 | 41.404 ± 8.479 a | 41.789 ± 8.525 b |
| Pigmentation area (mm 2 ) | ||||||
| Test | 26.850 ± 12.671 | 24.050 ± 10.118 b | 22.400 ± 9.087 b,c | 22.650 ± 10.080 b,d | 23.100 ± 11.097 b,c | 22.950 ± 11.307 b,c |
| Control | 22.600 ± 8.262 | 21.300 ± 8.014 b | 20.750 ± 8.252 b | 20.500 ± 8.345 b | 20.050 ± 7.824 b | 19.900 ± 8.039 b |
| Erythema (a-value) | ||||||
| Test | 10.151 ± 2.895 | 10.168 ± 2.685 | 9.836 ± 2.794 | 9.671 ± 2.834 c | 9.726 ± 2.904 c | 9.496 ± 2.610 c |
| Control | 10.061 ± 2.715 | 10.048 ± 2.746 | 9.951 ± 2.791 | 10.208 ± 3.356 | 10.320 ± 3.164 | 10.425 ± 3.504 |
| ACSS score | ||||||
| Test | 2.900 ± 0.308 | 2.000 ± 0.459 b,d | 2.000 ± 0.459 b,d | 1.950 ± 0.394 b,d | 1.850 ± 0.489 b,d | 1.900 ± 0.553 b,d |
| Control | 2.900 ± 0.308 | 2.900 ± 0.308 | 2.850 ± 0.489 | 2.850 ± 0.489 | 2.800 ± 0.523 | 2.800 ± 0.523 |
| Investigator GAIS | ||||||
| Test | - | 3.500 ± 0.607 | 4.050 ± 0.510 f | 4.250 ± 0.550 e | 4.500 ± 0.513 f | 4.450 ± 0.510 f |
| Control | - | 3.150 ± 0.671 | 3.550 ± 0.759 | 3.850 ± 0.745 | 4.000 ± 0.795 | 3.850 ± 0.671 |
| Participant GAIS | ||||||
| Test | - | 3.900 ± 0.447 | 4.250 ± 0.716 e | 4.350 ± 0.587 e | 4.350 ± 0.587 f | 4.500 ± 0.513 f |
| Control | - | 3.700 ± 0.571 | 3.550 ± 0.759 | 3.950 ± 0.510 | 3.850 ± 0.489 | 3.850 ± 0.366 |
Histological evaluation of ex vivo human skin 24 h post-intradermal injection revealed that phADM displayed a homogeneous and diffuse distribution within the dermis, preserving the native tissue architecture ( Figure 3 A).
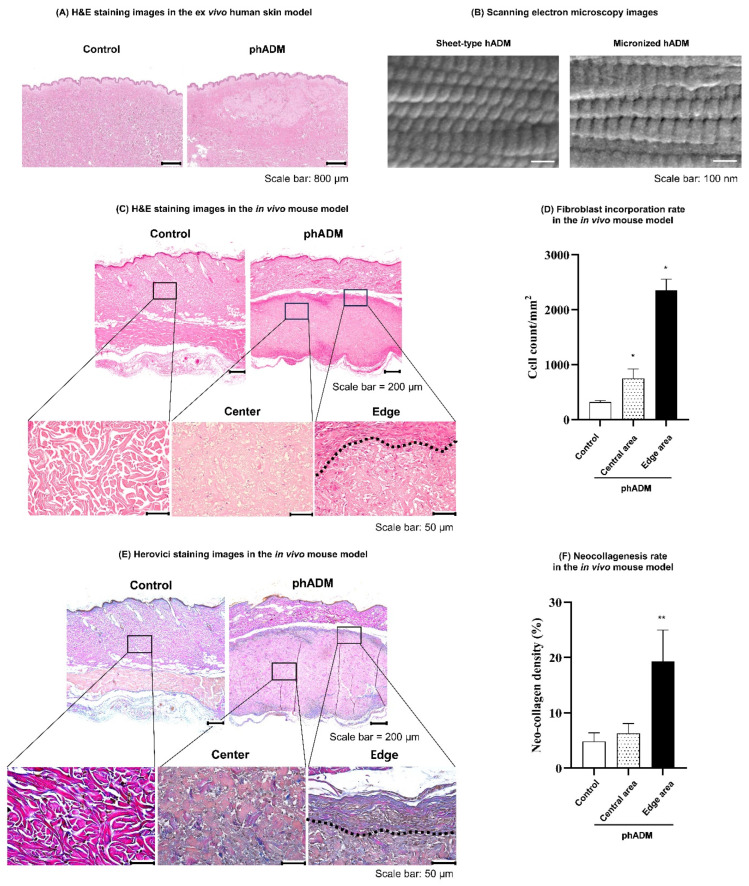
Figure 3 (A) Histological images of ex vivo human skin tissues 24 h after injection of phADM or HA. (B) Scanning electron microscopy (SEM) analysis of collagen microarchitecture in sheet-type and phADM (magnification: 50,000×). (C–F) Histological assessment in the in vivo mouse model 1 week after intradermal injection of phADM. (C) H&E staining images in the control and phADM samples. (D) Fibroblast incorporation rate in the control group, the central and edge areas of the phADM group. (E) Herovici staining images in the control and phADM samples. Newly formed collagen are the blue-stained regions. (F) Fibroblast incorporation rate in the control group, the central and edge areas of the phADM group. Data are presented as mean ± SD. * comparison to the control group, * p < 0.05, ** p < 0.01. H&E, hematoxylin and eosin. phADM, particulated human acellular dermal matrix.High-magnification scanning electron microscopy (SEM) analysis demonstrated that the ECM architecture of phADM was well preserved ( Figure 3 B). Compared with sheet-type hADM, phADM retained comparable ultrastructural features following micronization, including well-aligned collagen fibrils and a characteristic D-banding pattern arranged in an orderly manner. These findings indicate that the native collagen ultrastructure and overall decellularized ECM architecture remained intact throughout the particulation and manufacturing processes.
In the in vivo rat model, pronounced fibroblast migration and integration into the implanted matrix were observed one week after intradermal injection of phADM ( Figure 3 C). This was accompanied by a significantly increased fibroblast density compared to controls ( Figure 3 D). Fibroblast accumulation was evident in both the central and peripheral regions of the phADM, with the highest density noted at the matrix–host interface. Consistently, Herovici (HV) staining demonstrated enhanced neocollagenesis in phADM-treated skin, predominantly at the matrix–host interface ( Figure 3 E). Quantitative analysis confirmed that neocollagen density was significantly higher in the peripheral region than in both the control and central regions ( Figure 3 F), suggesting localized collagen synthesis coupled with fibroblast migration and matrix integration.
Throughout the 20-week study, the test group demonstrated a marked reduction in TEWL ( p < 0.05), in contrast to the changes observed in the control group ( Figure 4 A, Table 2 ). Comparative analysis revealed that the test group achieved significantly superior TEWL improvement relative to the control group at weeks 8 and 20 ( p < 0.05), underscoring the early and long-term efficacy of phADM in enhancing skin barrier integrity. Regarding skin hydration, while both groups showed progressive improvement, the test group exhibited significantly superior hydration levels compared to controls from week 8 onwards ( p < 0.05; Figure 4 B, Table 2 ).
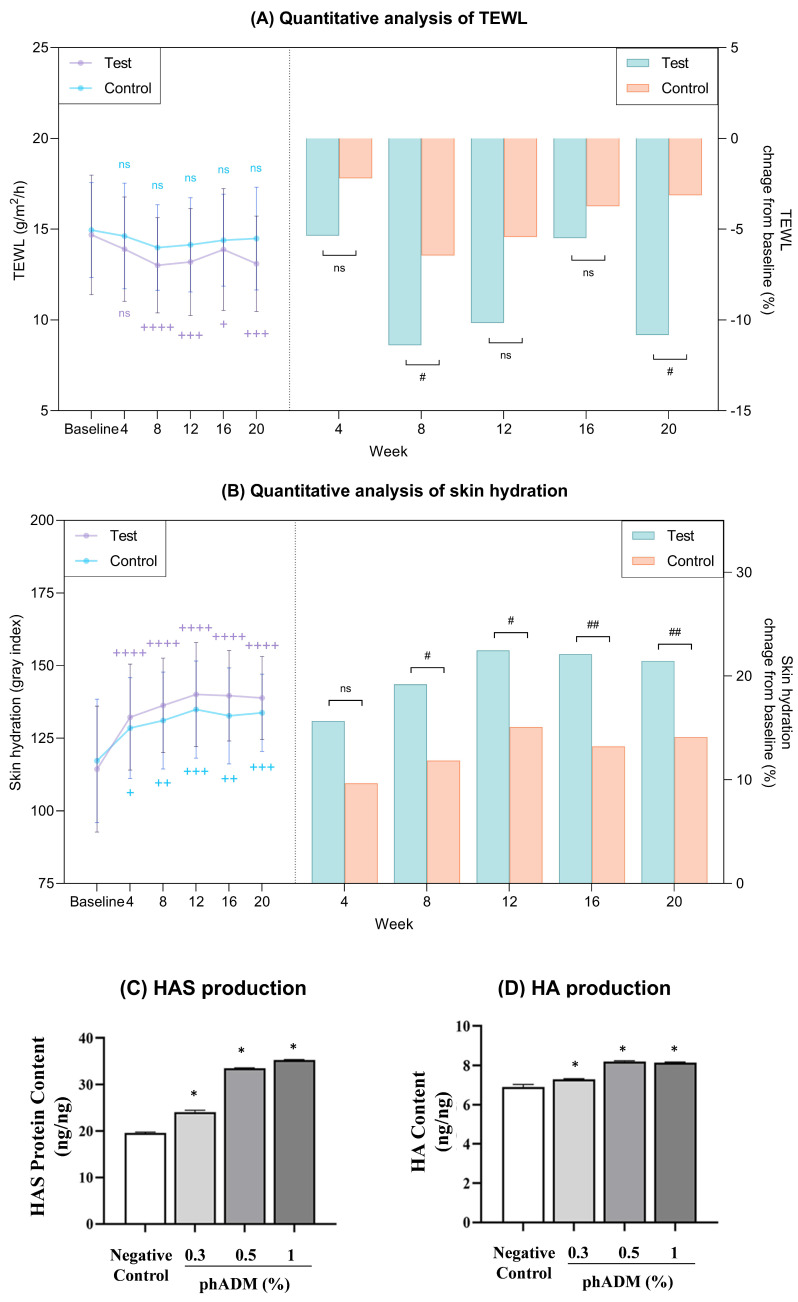
Figure 4 (A,B) Clinical reduction in TEWL and improvement in skin hydration after 20 weeks in the test and control groups. (A) Quantitative measurement of TEWL (left) and percent change from baseline (right) in each group. (B) Quantitative measurement of skin hydration (left) and percent change from baseline (right) in each group. (C,D) phADM’s effect on hyaluronic acid synthesis in human epidermal keratinocytes. The production of HAS (C) and HA (D) significantly increased 24 h after phADM treatment with increasing concentrations (0.3–1%). Data are presented as mean ± SD. + comparison to baseline within groups, + p < 0.05, ++ p < 0.01, +++ p < 0.005, ++++ p < 0.001. # comparison of change from baseline between groups at each time point, # p < 0.05, ## p < 0.01. TEWL, transepidermal water loss; ns, not significant. ∗ comparison with negative control, ∗ p < 0.05. HA, hyaluronic acid. HAS, hyaluronic acid synthase. phADM, particulated human acellular dermal matrix.临床皮肤屏障与保湿指标:试验组TEWL在第8与第20周、水合自第8周起均显著优于对照组(p<0.05);图内亦含体外角质形成细胞透明质酸合成的预临床数据。For the in vitro validation setting, human epidermal keratinocytes (HEKs) were exposed to varying doses of phADM for 24 h and exhibited no cytotoxic effects compared to negative controls ( Figure S2 ). Based on these data, concentrations of 0.3%, 0.5%, and 1% were utilized for further assays. The evaluation of HA synthesis revealed that phADM treatment for 24 h significantly increased hyaluronan synthase (HAS) protein levels in a dose-dependent manner ( p < 0.05; Figure 4 C). Moreover, the intracellular HA content was significantly elevated, particularly at 0.5% and 1% concentrations ( p < 0.05; Figure 4 D).
To validate the restorative effects of phADM on the basement membrane, we utilized an ultraviolet B (UVB)-irradiated ex vivo human skin model to assess the expression of key structural proteins. Immunofluorescence analysis conducted 72 h post-injection revealed significant restoration of basement membrane integrity. Specifically, while UVB irradiation markedly disrupted and downregulated nidogen I and collagen IV staining along the dermal–epidermal junction (DEJ), phADM treatment preserved the continuity and intensity of both markers ( Figure 5 A). Quantitative analysis confirmed a significant recovery of nidogen I and collagen IV expression in phADM-treated skin compared to UVB-irradiated controls ( p < 0.05; Figure 5 B,C), suggesting that phADM facilitates rapid basement membrane repair following UVB-induced damage.
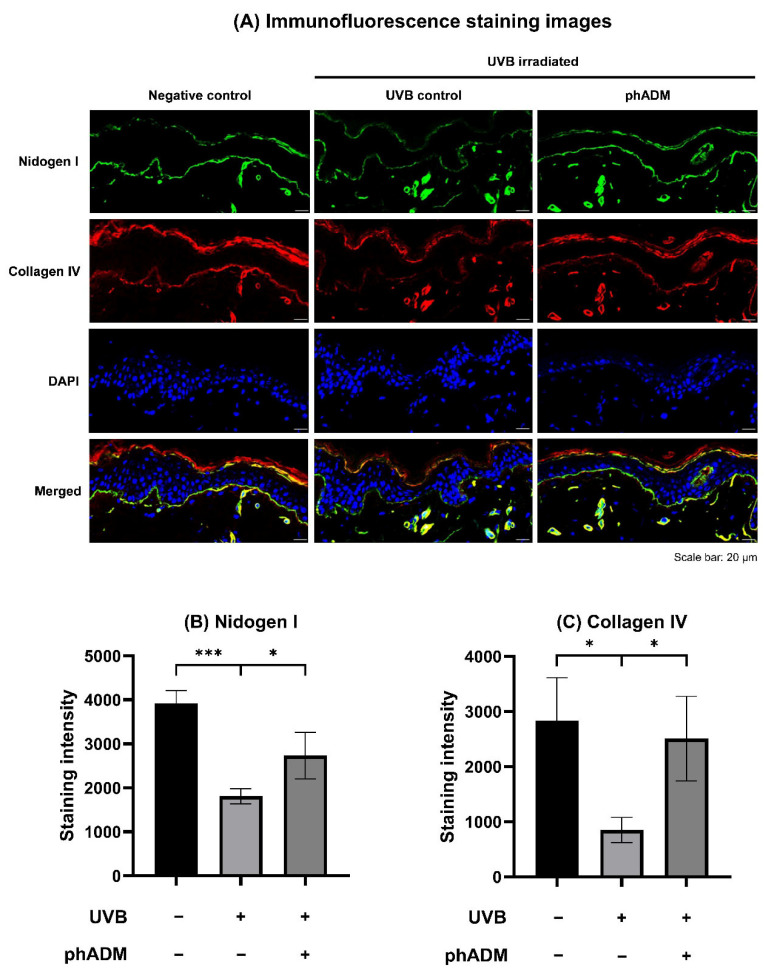
Figure 5 Immunofluorescence assessment in the UVB-irradiated ex vivo human skin model. (A) Immunofluorescence staining images. Nidogen I is stained green, Collagen IV is stained red, and DAPI is stained blue. Scale bar = 20 µm. Quantitative analysis of the staining intensity of Nidogen I (B) and Collagen IV (C). Data are presented as mean ± SD. ∗ comparison between groups, ∗ p < 0.05, ∗∗∗ p < 0.005. DAPI, 4′,6-diamidino-2-phenylindole. phADM, particulated human acellular dermal matrix. UVB, ultraviolet B.
The effects of phADM on HDFs proliferation were evaluated following treatment with increasing concentrations of phADM (0.3%, 0.5%, and 1%) for 24, 48, and 72 h. Morphological assessment showed that HDFs maintained a typical spindle-shaped phenotype across all phADM concentrations, with no evidence of cytotoxicity or abnormal cellular morphology at 72 h ( Figure 6 A).
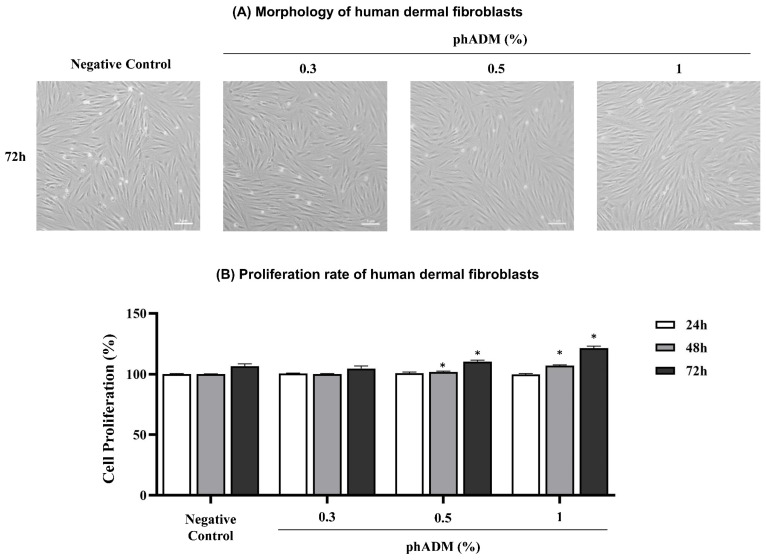
Figure 6 (A) Morphology of human dermal fibroblasts after 72 h of treatment with increasing concentrations of phADM (0.3–1%), scale bar: 5 μm. (B) Proliferation rate of human dermal fibroblasts after 24, 48, and 72 h of treatment with increasing concentrations of phADM (0.3–1%). Data are presented as mean ± SD. ∗ comparison to the negative control at the same time point, ∗ p < 0.05. phADM, particulated human acellular dermal matrix.Quantitative analysis demonstrated a concentration- and time-dependent increase in HDF proliferation after the phADM treatment ( p < 0.05, Figure 6 B). While no significant differences were observed at 24 h, treatment with 0.5% and 1% phADM significantly enhanced cell proliferation at 48 and 72 h compared with the negative control.
The effects of phADM on extracellular matrix (ECM) protein synthesis and growth factor production were evaluated in HDFs 24 h after treatment with increasing concentrations of phADM (0.3–1%). phADM significantly increased the protein levels of major structural ECM components, including collagen I, collagen III, and elastin, in a concentration-dependent manner ( p < 0.05, Figure 7 A–C). In parallel, phADM markedly enhanced the production of pro-regenerative growth factors, such as vascular endothelial growth factor (VEGF), fibroblast growth factor (FGF), platelet-derived growth factor (PDGF), while significantly reducing transforming growth factor-β1 (TGF-β1) levels compared with the negative control ( p < 0.05, Figure 7 D–G). These results indicate that phADM promotes a regenerative ECM remodeling profile in HDFs by stimulating matrix synthesis and angiogenic growth factor production while limiting pro-fibrotic signaling.
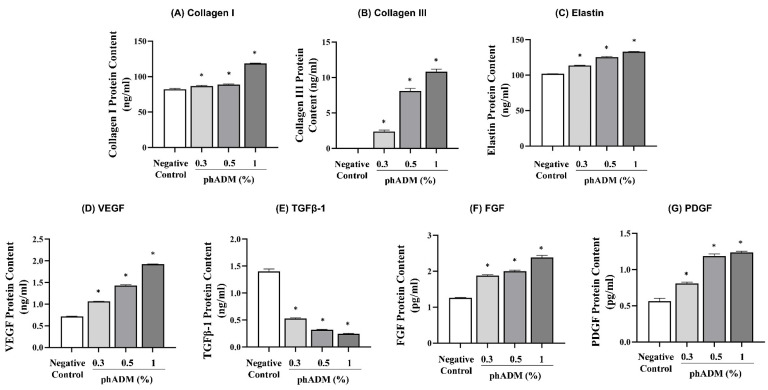
Figure 7 phADM’s effect on the production of collagen, elastin, and growth factors in human dermal fibroblasts. The production of (A) Collagen I, (B) Collagen III, (C) Elastin, (D) VEGF, (E) TGF-1, (F) FGF, and (G) PDGF significantly increased 24 h after phADM treatment with increasing concentrations (0.3–1%). Data are presented as mean ± SD. ∗ comparison with negative control, ∗ p < 0.05. VEGF, vascular endothelial growth factor. TGFβ-1, transforming growth factor beta 1. FGF, fibroblast growth factor. PDGF, platelet-derived growth factor. phADM, particulated human acellular dermal matrix.
Following 24 h of exposure to increasing concentrations of phADM, mouse macrophages exhibited no significant changes in cell viability compared with the negative control ( Figure S1 ). Based on these results, phADM concentrations of 0.3, 0.5, and 1% were selected for subsequent experiments. To evaluate the anti-inflammatory effects of phADM, mouse macrophages were stimulated with lipopolysaccharide (LPS, 1 µg/mL) and co-treated with phADM (0.3–1%) for 24 h, with NG-methyl-L-arginine acetate salt (L-NMMA, 100 µM) used as a positive control. LPS stimulation markedly increased the production of pro-inflammatory mediators, including interleukin-1β (IL-1β), interleukin-6 (IL-6), tumor necrosis factor-α (TNF-α), and prostaglandin E 2 (PGE-2). Treatment with phADM significantly and dose-dependently suppressed LPS-induced cytokine and mediator production across all measured endpoints ( p < 0.05; Figure 8 A–D). Collectively, these findings demonstrate that phADM exerts potent anti-inflammatory effects in activated macrophages.
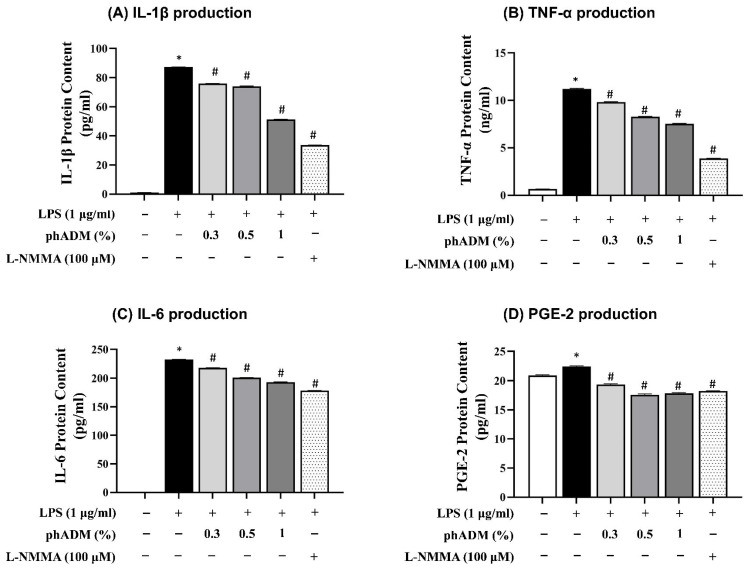
Figure 8 Anti-inflammatory properties of phADM in mouse macrophages. After 24 h of treatment with LPS (1 µg/mL), the production of IL-1β (A), TNF-α (B), IL-6 (C), and PGE-2 (D) in mouse macrophages significantly increased. Treatment with phADM (0.3–1%) successfully counteracted this increase. L-NMMA (100 µM) served as positive control. Data are presented as mean ± SD. ∗ comparison with negative control, ∗ p < 0.05. # comparison with LPS control, # p < 0.05. LPS, lipopolysaccharide. phADM, particulated human acellular dermal matrix. L-NMMA, N-monomethyl-L-arginine. IL, interleukin. TNF-α, tumor necrosis factor–alpha. PGE-2, prostaglandin E2.
Regarding ACSS scores, the test group demonstrated a statistically significant and sustained reduction from baseline at all assessment time points ( p < 0.05; Figure 9 A, Table 2 ), whereas the control group showed no meaningful change throughout the 20-week study period. Consequently, the magnitude of the ACSS score reduction was significantly greater in the test group than in the control group.
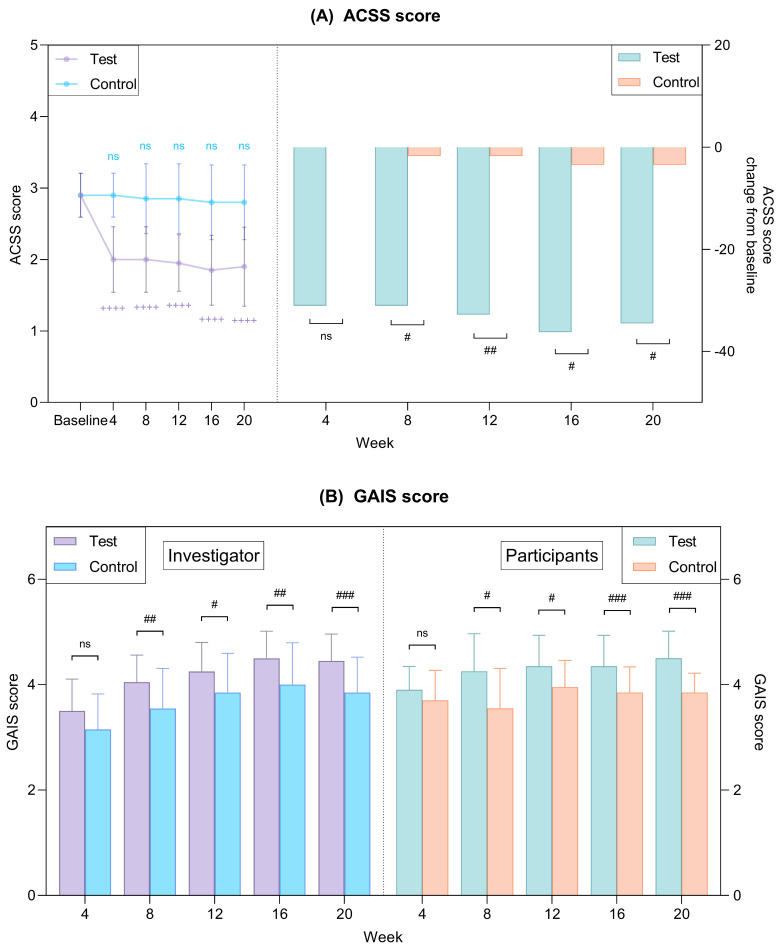
Figure 9 Subjective evaluation from the investigators and participants. (A) ACSS scores. (B) GAIS scores from the investigators and participants. Data are presented as mean ± SD. + comparison to baseline within groups, ++++ p < 0.001. # comparison between groups at each time point, # p < 0.05, ## p < 0.01, ### p < 0.005. ns, not significant. ACSS, Allergan Cheek Smoothness Scale. GAIS, Global Aesthetic Improvement Scale.研究者与受试者主观评分:试验组ACSS各时点均较基线显著下降(p<0.05),GAIS自第8至20周均显著高于对照组(p<0.05)。Investigator-assessed Global Aesthetic Improvement Scale (GAIS) scores in the test group were significantly higher than those in the control group from week 8 through week 20 ( p < 0.05). Consistent with these findings, participant-assessed GAIS scores also exhibited a similar pattern, with significantly greater improvements observed in the test group compared with the control group ( p < 0.05; Figure 9 B, Table 2 ).
Representative clinical images illustrate visible reductions in nasolabial fold and infraorbital wrinkles in both groups after 20 weeks of treatment ( Figure 10 A,C). Quantitative analyses revealed that nasolabial fold depth ( Figure 10 B) and infraorbital wrinkle severity ( Figure 10 D) were significantly reduced from baseline at all evaluated time points over the 20-week period in the test group ( p < 0.05; Table 2 ). Moreover, these improvements were significantly greater in the test group than in the control group at corresponding visits ( p < 0.05).
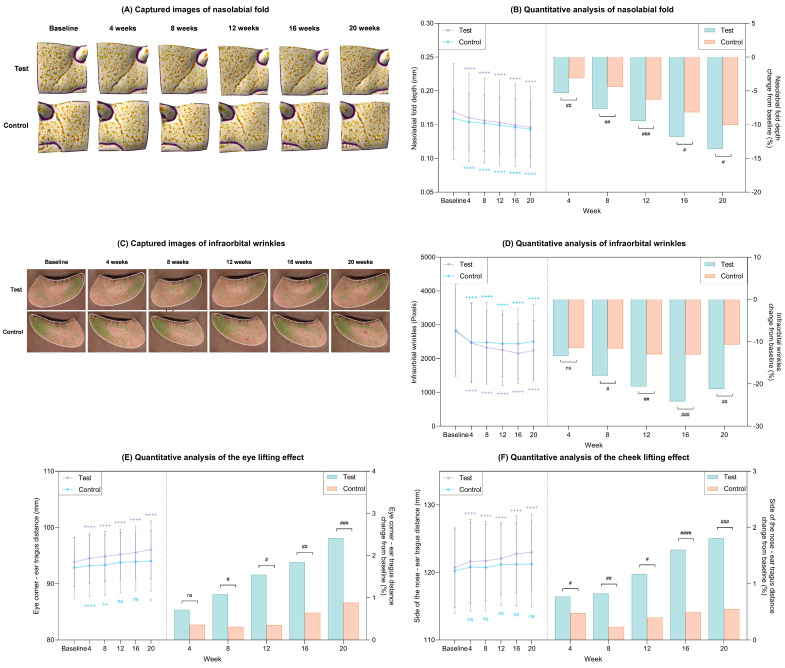
Figure 10 Clinical wrinkle reductions and lifting effects after 20 weeks of treatment in the test and control groups. (A) Captured images of nasolabial folds via Antera 3D CS. (B) Quantitative measurement of nasolabial fold depth (left) and percent change from baseline (right) in each group. (C) Captured images of infraorbital wrinkles via Eve V. (D) Quantitative measurement of infraorbital wrinkles (left) and percent change from baseline (right) in each group. (E) Quantitative measurement of the contour of the eye area (left) and percent change from baseline (right) in each group. (F) Quantitative measurement of the contour of the cheek area (left) and percent change from baseline (right) in each group. Data are presented as mean ± SD. + comparison to baseline within groups, + p < 0.05, ++ p < 0.01, ++++ p < 0.001. # comparison of change from baseline between groups at each time point, # p < 0.05, ## p < 0.01, ### p < 0.005, #### p < 0.001. ns, not significant.20周皱纹与提升效果:试验组鼻唇沟深度、眶下皱纹各时点显著减少且优于对照(p<0.05),第20周眼周与颊部提升幅度亦显著更大。Assessment of lifting effects at week 20 demonstrated that the test group achieved significantly more pronounced lifting of both the periorbital and cheek regions compared with baseline and with the control group ( p < 0.05; Figure 10 E,F).
Changes in pore area over the 20-week study period are illustrated in Figure 11 A. Quantitative analyses demonstrated a progressive and statistically significant reduction in pore area from baseline in both groups throughout the trial ( p < 0.05; Figure 11 B, Table 2 ). Notably, the magnitude of pore area reduction was significantly greater in the test group than in the control group from week 12 onward ( p < 0.05; Figure 11 B, Table 2 ), indicating a sustained treatment effect of phADM on pore area reduction over time. With respect to skin elasticity, both groups exhibited significant improvements from baseline at week 20 ( p < 0.05; Figure 11 C, Table 2 ). However, the test group showed significantly greater enhancement in skin elasticity at weeks 4 and 20 compared with the control group ( p < 0.05; Figure 11 C, Table 2 ).
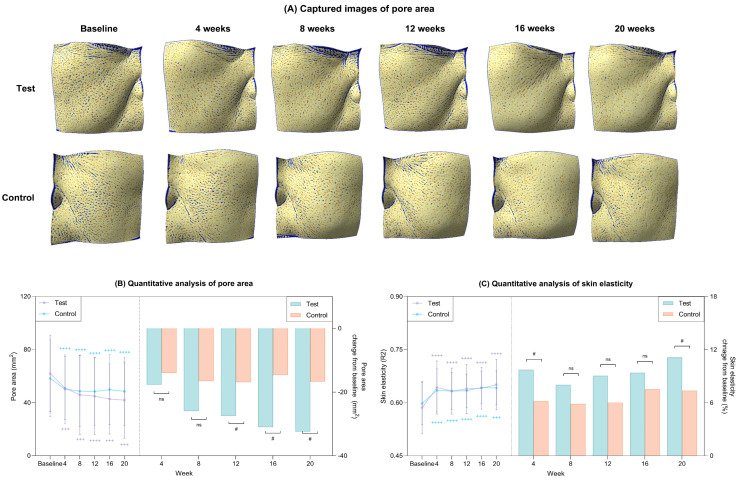
Figure 11 Clinical reductions in pore area and improvement in skin hydration after 20 weeks of treatment in the test and control groups. (A) Captured images of pores via Antera 3D CS. (B) Quantitative measurement of pore area (left) and percent change from baseline (right) in each group. (C) Quantitative measurement of skin elasticity (left) and percent change from baseline (right) in each group. Data are presented as mean ± SD. + comparison to baseline within groups, +++ p < 0.005, ++++ p < 0.001. # comparison of change from baseline between groups at each time point, # p < 0.05. ns, not significant.
Representative Antera 3D images illustrate clinical changes in pigmentation area after 20 weeks in the test and control groups ( Figure 12 A). Quantitative analysis revealed a significant and progressive reduction in pigmentation area in the test group over the 20-week study period ( p < 0.05; Figure 12 B, Table 2 ), with reductions that were significantly greater than those observed in the control group ( p < 0.05). Meanwhile, the erythema index decreased in the test group, whereas an increasing trend was observed in the control group ( Figure 12 C, Table 2 ).
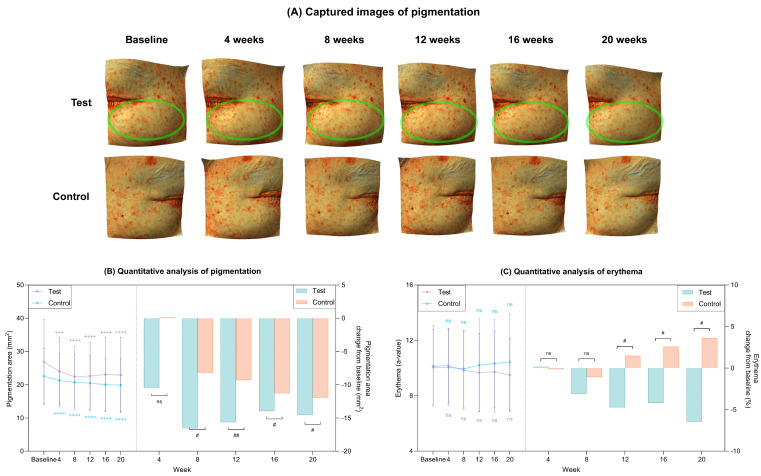
Figure 12 Clinical reductions in pigmentation area and erythema after 20 weeks of treatment in the test and control groups. (A) Captured images of pigmentation via Antera 3D CS. The green eclipses indicate the areas of improvement. (B) Quantitative measurement of pigmentation area (left) and percent change from baseline (right) in each group. (C) Quantitative measurement of erythema (left) and percent change from baseline (right) in each group. Data are presented as mean ± SD. + comparison to baseline within groups, +++ p < 0.005, ++++ p < 0.001. # comparison of change from baseline between groups at each time point, # p < 0.05, ## p < 0.01. ns, not significant.To further substantiate the depigmenting effects of phADM observed in the clinical setting, mechanistic validation studies were conducted using in vitro mouse melanoma cells. Following 72 h of treatment with increasing concentrations of phADM, melanoma cell viability remained comparable to that of the negative control across all tested conditions ( Figure S3 ). Based on these findings, phADM concentrations of 0.3, 0.5, and 1% were selected for subsequent experiments.
Stimulation with α-melanocyte-stimulating hormone (α-MSH) significantly increased both intracellular and extracellular melanin levels compared with the negative control. In contrast, phADM treatment markedly and dose-dependently suppressed melanin accumulation in both compartments ( Figure 13 A,B), with the greatest inhibitory effect observed at a concentration of 1%. Consistent with the reduction in melanin production, phADM significantly downregulated the expression of key melanogenesis-related genes, including microphthalmia-associated transcription factor ( MITF ), tyrosinase-related protein 1 ( TRP1 ), and tyrosinase ( TYR ), compared with the α-MSH-stimulated control. Gene expression levels decreased in a concentration-dependent manner, with the most pronounced inhibition observed at higher phADM concentrations ( Figure 13 C–E). Collectively, these findings suggest that phADM may attenuate melanogenesis by suppressing melanin synthesis through inhibition of the MITF–TYR–TRP1 signaling axis.
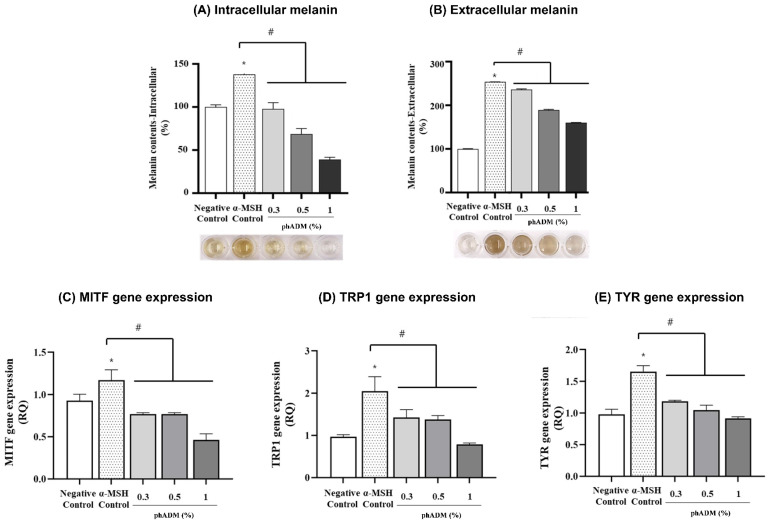
Figure 13 Depigmentation effect of phADM in mouse melanoma cells. After 72 h, α-MSH treatment significantly increased the production of intracellular melanin (A) and extracellular melanin (B), as well as enhanced the gene expression of MITF (C), TRP1 (D), and TYR (E). phADM with increasing concentrations (0.3–1%) successfully reversed these changes. Data are presented as mean ± SD. * comparison to negative control, * p < 0.05. # comparison to α-MSH control, # p < 0.05. α-MSH, alpha-melanocyte stimulating hormone. MITF, microphthalmia-associated transcription factor. TRP1, tyrosinase-related protein 1. TYR, tyrosinase. phADM, particulated human acellular dermal matrix.
In the clinical trial, no serious adverse events occurred during the study, and mild events (such as transient erythema and slight swelling) resolved spontaneously without treatment.
Skin senescence is a cumulative process driven by the interplay of intrinsic aging and extrinsic stressors. This “inflammaging” phenotype—characterized by the accumulation of senescent cells and the senescence-associated secretory phenotype (SASP)—precipitates ECM degradation, basement membrane disruption, and dysregulated melanocyte–keratinocyte signaling [ 22 ]. Clinically, these pathophysiological changes manifest as multidimensional tissue decline, including wrinkles, sagging, barrier dysfunction, pore enlargement, and pigmentary irregularities [ 22 , 23 , 24 ], prompting the research in oral, topical, and injectable rejuvenating agents [ 25 , 26 , 27 , 28 ]. Against this biological backdrop, therapeutic strategies that move beyond symptom-level correction toward restoration of the dermal microenvironment have become increasingly relevant, underscoring the importance of biomaterials that can reconstitute native ECM structure and function at the tissue level.
In this context, the dermis possesses distinct intrinsic characteristics that extend beyond its role as a surface covering. This includes a highly ECM microarchitecture, biomechanical support capacity, growth factor sequestration, matrikine-mediated signaling, and its function as a cellular niche supporting fibroblast adhesion, migration, angiogenesis, and tissue remodeling [ 29 , 30 , 31 , 32 , 33 , 34 ]. These properties fundamentally underlie the dermis’s utility in tissue reconstruction, repair, and replacement. Furthermore, particulation of dermis tissue alters only its morphological form factor while preserving its biochemical identity, ECM composition, and biofunctional attributes relevant to tissue restoration [ 16 ]. This provides the foundation to utilize phADM to comprehensively restore and repair skin function and structure.
Our findings demonstrate that phADM treatment leads to significant clinical improvements in skin density, volume, and elasticity, accompanied by marked reductions in wrinkle severity and pore size, as well as lifting effects in the periorbital and cheek regions. These clinical outcomes are mechanistically supported by the capacity of phADM to promote constructive dermal remodeling through preserved ECM architecture and active host–matrix interactions. High-magnification SEM analysis confirmed that phADM retains ultrastructural ECM features comparable to those of sheet-type hADM, a material with a long history of safe clinical application in reconstructive surgery [ 16 , 17 , 18 , 19 ]. Preservation of this native ECM organization enables homogeneous intradermal distribution following injection while maintaining tissue architecture, as further corroborated by histological evaluation. Importantly, this structural and biological compatibility was substantiated by in vivo evidence demonstrating active fibroblast migration and integration into the matrix, together with localized neocollagenesis at the matrix–host interface. In parallel, in vitro assays showed that phADM stimulated HDFs proliferation and enhanced the synthesis of collagen, elastin, and key angiogenic factors, including VEGF, FGF, and PDGF. These findings are consistent with prior reports indicating that phADM supports fibroblast adhesion, proliferation, and ECM deposition with favorable tolerability in soft tissue augmentation [ 16 , 17 ]. Collectively, these mechanisms likely account for the observed clinical benefits, supporting the interpretation that phADM undergoes minimal structural alteration during particulation and therefore retains its function as a minimally manipulated, human-derived biomaterial capable of restoring dermal biomechanics.
A critical finding of this study is the restoration of the skin barrier and basement membrane integrity. The dermal-epidermal junction (DEJ) is compromised in photoaged skin [ 35 ]. Our ex vivo UVB-irradiated model demonstrated that phADM treatment significantly upregulated key basement membrane proteins, Nidogen I and Collagen IV [ 36 , 37 ], indicating structural reinforcement of the DEJ. Concurrently, in vitro data showed a dose-dependent increase in HAS expression and intracellular HA content, which plays an integral part in regulating moisture [ 38 ]. These molecular changes parallel the observed reductions in TEWL and improvements in hydration in the test group, consistent with graft-based studies reporting recovery of approximately 82–86% of normal skin barrier and hydration function following acellular dermal matrix-based reconstruction [ 39 ]. As a while, these findings support a dual mechanism where phADM reinforces the physical barrier while boosting endogenous hydration capacity.
Furthermore, phADM exhibited significant depigmenting efficacy, addressing the dysregulated melanogenesis often associated with aging. While clinical results showed a progressive reduction in pigmentation area, mechanistic assays suggested that phADM downregulates the MITF–TYR–TRP1 signaling axis, thereby suppressing melanin synthesis at the transcriptional level [ 40 ]. This anti-melanogenic effect, combined with the observed reduction in erythema, suggests that phADM may modulate the inflammatory milieu that drives post-inflammatory hyperpigmentation and uneven skin tone [ 41 ].
Uniquely, the safety profile of phADM appears distinct from synthetic biostimulators (e.g., PLLA, CaHA). While synthetic agents typically leverage a controlled inflammatory response to induce neocollagenesis [ 42 ], phADM demonstrated potent anti-inflammatory effects in activated macrophages by suppressing LPS-induced cytokines (IL-1β, TNF-α, IL-6) [ 43 ], thereby maintaining the homeostasis of the dermal microenvironment. This suggests that phADM promotes restoration through biocompatible and homeostatic tissue integration rather than inflammation-driven neocollagenesis, offering a theoretical advantage in minimizing the risk of granulomas or persistent nodules. Consistently favorable participant and investigator assessments with no observed serious adverse events further support the translational potential of phADM within the skin-booster landscape.
Despite these promising findings, several limitations warrant consideration. First, the small sample size and split-face design, while controlling for inter-individual variability, limit generalizability. Second, the 20-week follow-up precludes the assessment of long-term durability and delayed adverse events. Third, as the test product was a mixture of phADM and a non-crosslinked HA carrier, separating the synergistic effects remains challenging, although the distinct regenerative markers observed suggest phADM as the primary bioactive driver. In addition, given the relatively small sample size and the large number of evaluated clinical endpoints across multiple time points, there is a potential risk of inflated type I error due to multiple comparisons. Although post hoc corrections were applied for within-group analyses, no formal adjustment for multiplicity across all endpoints was performed. Therefore, some statistically significant findings should be interpreted with caution, and confirmation in larger, adequately powered studies is warranted. Finally, while transcriptional changes in melanogenesis were significant, protein-level validation is required to fully elucidate the pathway. Future research should involve larger, controlled trials with active comparators and advanced spatial profiling to further define the regenerative potential of injectable phADM.
This 20-week, randomized, split-face, double-blinded, prospective clinical trial was conducted from November 2024 to May 2025 at Severence Hospital, Seoul, Republic of Korea, in accordance with the Declaration of Helsinki. The study protocol received approval from the Clinical Trial Review Board of the Severance Hospital (IRB number 1-2024-0042, date: 12 September 2024) and was registered on clinicaltrials.gov (Identifier: NCT07155278, date: 4 September 2025). A total of 20 participants were recruited in consideration of the number of subjects that can be enrolled within 3 months after IRB approval in a typical clinical setting. Inclusion criteria comprised male or female between the ages of 30 and 65, having an ACSS score of 2 to 3 ( Table S1 ) at screening, and being available for follow-up throughout the study period. The ACSS is used to assess the skin texture, creases, and crosshatching of the cheek area [ 44 ]. Subjects were excluded if they had received or planned to receive other cosmetic procedures such as facial fillers, botulinum toxin injections, or mesotherapy within 12 months of screening. Other exclusion criteria included a history of inflammatory skin diseases, contagious diseases, skin grafts, autoimmune diseases, complex allergies, and having recently used external or oral medications for skin improvement within six months of screening. Each right or left side of the eligible participants’ faces was randomly assigned one of the two treatment arms.
Randomization was conducted using the Randomization module of SAS software (version 9.4) by an independent investigator. Test products were applied to each half of the participants’ faces according to their allocated randomization numbers, ensuring that participants were blinded to treatment assignments. The analyzing investigator was also unaware of treatment groups during the assessment and comparison of skin parameters, ensuring the double-blinded design. All participants were informed about the study’s goals, procedures, and possible risks, and written informed consent was provided before their participation.
phADM (Elravie Re2O, L&C Bio Co., Ltd., Seoul, Republic of Korea) was manufactured using donor-derived human dermal tissue obtained with informed consent for cosmetic use. All procedures, from donor tissue procurement through processing and packaging, were conducted in strict accordance with the guidelines of the American Association of Tissue Banks (AATB). The tissue handling and manufacturing processes complied with established safety and quality standards to ensure appropriate donor screening, traceability, and sterility. As the material was derived from consented donor tissue and processed following recognized regulatory guidelines, no ethical concerns were associated with its use in this study.
The control product was a non-crosslinked HA skin booster (Elravie Balance; Humedix Co., Ltd., Gyeonggi, Republic of Korea) containing 20 mg of HA per 1.5 mL and lidocaine. The test product was prepared by mixing 150 mg of phADM with 1.5 mL of the control HA product, 2.1 mL of normal saline, and 0.4 mL of lidocaine, yielding a total volume of 4.0 mL. Consequently, the administered volume of 1.5 mL per side contained approximately 56.25 mg of phADM and 7.5 mg of HA. Elravie Re2O is a human tissue product regulated by the Ministry of Food and Drug Safety (MFDS) of Korea. It preserves the ECM structure, consisting of approximately 80% collagen, 3% elastin, and 0.4% sGAGs, with a residual DNA content of <50 ng/mg. In a split-face design, a blinded board-certified dermatologist administered 1.5 mL of the test product to one side of the face and 1.5 mL of the control product to the other. To ensure consistent injection depth and dosing accuracy, an automated injection device (Dermashine; Huons Meditech Co., Ltd., Seongnam, Republic of Korea) was employed, targeting the mid-dermis layer.
To evaluate the preservation of ECM architecture in phADM, SEM was employed. phADM and a commercially available sheet-type human acellular dermal matrix (hADM; MegaDerm ® , L&C Bio Co., Ltd., Seoul, Republic of Korea) were sputter-coated with a thin carbon layer using an ion sputter coater (EM ACE600; Leica Microsystems, Wetzlar, Germany). Surface ultrastructure was subsequently examined using a field-emission scanning electron microscope (MERLIN; Zeiss, Oberkochen, Germany).
Skin measurements were conducted at baseline (Visit 1) and at 1, 4, 8, 12, 16, and 20 weeks post-treatment (Visits 2–7). For each measurement session, participants’ faces were first cleansed, then they were acclimatized for 30 min in a controlled environment maintained at a temperature of 20–24 °C and 45–55% relative humidity. Subsequently, we used various devices to quantitatively measure specific skin indices:Nasolabial fold depth, pigmentation area, and pore area were measured using the Antera 3D CS (Miravex, Dublin, Ireland), which captures 3D surface images and quantifies wrinkle depth in millimeters (mm), pigmentation and pore area in mm 2 .Infraorbital wrinkles were measured using the Eve V (EVELAB INSIGHT, Singapore) in pixels. The device utilizes a detailed 3D assessment of facial conditions through contour evaluation and high-resolution imaging.Skin volume was measured in cubic millimeters (mm 3 ) with the 3D LifeViz micro (QuantifiCare, Biot, France), a non-contact device utilizing structured light projection.Skin density was evaluated in percentage (%) using the Skin Scanner (tpm, Luneburg, Germany), which employs a 22 MHz ultrasound transducer to generate density images.Eye area lifting and cheek area lifting were assessed with the Morpheus3D (Morpheus, Gyeonggi, Republic of Korea), a medical image analysis device that measures the increase in curve length in millimeters (mm) to determine the degree of lifting. Specifically, the eye lifting effect is measured as the curve distance from the eye corner to the ear tragus, while the cheek lifting influence is calculated as the curve length from the side of the nose to the ear tragus.Erythema (a-value) was measured using the VISIA CR (Canfield, NJ, USA), a device capturing standardised, high-resolution digital images of the entire face using different light sources.Skin hydration (gray index) was assessed using Moisture Map MM 100 Courage & Khazaka, Köln, Germany), which uses capacitance imaging to detect the distribution of moisture.TEWL (g/m 2 /h) was assessed using the Tewameter (Courage & Khazaka, Köln, Germany), which measures the density gradient of the water evaporation from the skin by a temperature sensor and a humidity sensor.Skin elasticity was evaluated using the Cutometer (Courage & Khazaka, Köln, Germany). The device measures skin elasticity via a suction phase lasting 2 s, followed by a 2-s relaxation phase. R2 (Visco-elasticity) is defined as the resistance to the mechanical force versus the ability to return.
Furthermore, the overall aesthetic improvement was subjectively evaluated by both participants and evaluators using the GAIS, which scores improvement relative to the pre-treatment state ( Table S2 ). Alterations in the evaluator-assessed ACSS score were also recorded.
The safety of the test products was assessed throughout the study period. During each visit, participants were monitored for any adverse reactions, and the use of any concomitant medications that could potentially affect the study was checked. All confirmed and reported adverse reactions from all subjects were compiled to determine the incidence rate, which was then used as data for the overall safety evaluation of the product.
Human skin tissue experiments were approved by the Global Medical Research Center Institutional Review Board (IRB No. GIRB-25613-OH, date: 25 June 2025). Skin tissues were collected from a 49-year-old Asian female donor, and each ex vivo experiment was repeated three times. Subsequently, two experimental groups were evaluated: a control and a phADM-treated group. The latter received a single intradermal injection of 0.1 mL at a uniform depth using a 27-gauge needle.
24 h after treatment, the human skin tissues were harvested, fixed in 10% neutral-buffered formalin, and paraffin-embedded for subsequent histological comparison between groups. Paraffin-embedded sections were mounted on glass slides, deparaffinized, and subjected to hematoxylin and eosin (H&E) staining. Briefly, nuclei were stained with hematoxylin (S3309; Dako, Glostrup, Denmark), rinsed thoroughly with running water, and counterstained with eosin (318906; Sigma-Aldrich, St. Louis, MO, USA) to visualize cytoplasmic structures. Following staining, the sections were washed, fully dehydrated, and mounted using a permanent mounting medium. Histological images of the epidermis and dermis were acquired using a light microscope (BX43F; Olympus, Tokyo, Japan) at magnifications of 40× or 400×. In phADM-injected tissues, histological differences were evaluated by comparing phADM-treated regions with adjacent untreated peripheral regions.
To assess the preventive effects of phADM against UVB-induced basement membrane disruption, an independent ex vivo experiment incorporating controlled UVB irradiation was performed. The human skin tissues from the previously mentioned donor were randomly assigned to three groups: a negative control, a UVB-irradiated control, and a UVB + phADM–treated group. phADM was prepared at a concentration of 30 mg/mL and administered as a single intradermal injection (0.1 mL) at a consistent depth using a 27-gauge needle. Following treatment, tissues were exposed to UVB irradiation using a UV cross-linker (BLX 312; Vilber Lourmat) at a wavelength of 312 nm, delivering a total dose of 300 mJ/cm 2 once daily for three consecutive days.
72 h after the final irradiation, the human skin samples were harvested, embedded in optimal cutting temperature compound, and cryosectioned at a thickness of 6 µm using a cryostat microtome (Leica Biosystems, Nußloch, Germany). Sections were mounted on silane-coated glass slides and incubated with primary antibodies against Nidogen-1 (MAB2570-100; R&D Systems, Minneapolis, MN, USA) and Collagen IV (ab6586; Abcam, Cambridge, UK). After washing, sections were incubated with fluorescence-conjugated secondary antibodies (Goat pAb to Rabbit IgG [H + L], A11012; Goat pAb to Mouse IgG [H + L], A11001; Invitrogen, Carlsbad, CA, USA), followed by nuclear counterstaining using a DAPI-containing mounting medium (VECTASHIELD ® HardSet Antifade Mounting Medium with DAPI; H-1500-10; Vector Laboratories, Newark, CA, USA). Fluorescent images were acquired at 200× magnification using a confocal laser scanning microscope (LSM700; Zeiss, Oberkochen, Germany). Quantitative analysis was performed using Zen image analysis software (version 3.13, Zeiss) by measuring fluorescence intensity normalized to basement membrane length, with higher values indicating increased expression of basement membrane-associated proteins. Each experiment is conducted three times.
The animal studies were performed after receiving approval of the Institutional Animal Care and Use Committee (IACUC) of Hulux Inc. (Approval No. Hulux-2025-02-006, approval date: 23 January 2025).
Male Sprague–Dawley (SD) rats (7 weeks old) were obtained from RaonBio Inc. (Republic of Korea). Upon arrival, animals were inspected for general health status, body weight, and overall condition and then acclimated for 7 days before experimentation. Rats were housed in polystyrene cages (W 277 × L 423 × H 194 mm) with two animals per cage under controlled environmental conditions: room temperature of 23 ± 3 °C, relative humidity of 55 ± 15%, and 10–20 air changes per hour. A 12 h light/dark cycle was maintained (lights on at 07:00 AM and off at 07:00 PM) with an illuminance of 150–300 lux. Standard chow (Teklad Certified Irradiated Global 18% Protein Rodent Diet 2018C, Envigo RMS Inc., Indianapolis, IN, USA) and UV-sterilized tap water were provided ad libitum. Cages were replaced once weekly, and water bottles were replaced at least twice per week. Animals were identified by tail marking using black, red, or blue permanent markers, and identification cards were attached to each cage.
After acclimation, a total of 4 rats were used for subsequent experiments. 5% phADM was administered via a single intradermal injection in separate disposable syringes into the dorsal region (center of the back) under inhalation anesthesia with isoflurane. Each animal received 2 injections on their dorsum, allowing for intra-individual comparison. The dosing volume for each implantation site was set at 50 µL, as determined in consultation with the study sponsor. General clinical observations were conducted once daily to monitor health status. 1 week after implantation, animals were anesthetized with isoflurane. The implanted areas, including the surrounding skin tissue, were excised. Animals were then euthanized by exsanguination following abdominal opening and severing of the cardiac vessels under deep anesthesia. Collected tissue samples were fixed in 4% paraformaldehyde and subsequently processed for histopathological evaluation.
For histological evaluation, tissues were fixed in 4% paraformaldehyde and processed into paraffin blocks. Paraffin sections were mounted onto glass slides, deparaffinized, and stained according to the procedures described below. After staining, the sections were washed, fully dehydrated, and mounted using a mounting solution. The prepared slides were examined and imaged using a light microscope (MD3000LED; Leica Microsystems, Wetzlar, Germany) at magnifications of 5× or 400×.
H&E staining was performed to evaluate cellular infiltration in rat skin tissues injected with Re2O. Deparaffinized tissue sections were stained with hematoxylin (104302; Merck, Rahway, NJ, USA) to visualize cell nuclei, followed by rinsing under running water. The cytoplasm was subsequently stained with eosin (230251; Sigma-Aldrich), after which the sections were washed and fully dehydrated. Cell numbers were quantified from the acquired histological images and normalized to unit area to assess cellular infiltration. A higher number of cells per unit area was interpreted as increased cellular density within the tissue sections.
Herovici staining was conducted to evaluate newly synthesized collagen in rat skin tissues injected with phADM. The staining was performed using a Herovici’s Stain Kit (ScyTek Laboratories, Inc., Logan, UT, USA) according to the manufacturer’s instructions. Histological images were analyzed using image analysis software (Zen image analysis; Zeiss). The total tissue area and the area of newly formed collagen (blue-stained regions) were quantified based on pixel values. The extent of neocollagen formation was expressed as the ratio of blue-stained collagen area to the total tissue area. A higher proportion of blue-stained regions indicated greater neocollagen deposition within the tissue sections.
HDFs (Thermo Fisher Scientific, Waltham, MA, USA), used for the evaluation of anti-wrinkle efficacy; mouse melanoma cells (B16F10, American Type Culture Collection, Manassas, VA, USA), used for the evaluation of skin-whitening efficacy; and mouse macrophages (RAW 264.7, American Type Culture Collection), used for the evaluation of anti-inflammatory efficacy, were cultured in Dulbecco’s Modified Eagle Medium (DMEM; Lonza, Walkersville, MD, USA) supplemented with 10% fetal bovine serum (FBS; Gibco, Waltham, MA, USA) and 1% penicillin–streptomycin (Gibco). HEKs (Thermo Fisher Scientific), used for the evaluation of moisturizing efficacy, were cultured in EpiLife™ Medium (Gibco) supplemented with Human Keratinocyte Growth Supplement (Gibco). All cells were maintained at 37 °C in a humidified atmosphere containing 5% CO 2 . HDFs were used in passage 6; mouse melanoma cells were used in passage 9; mouse macrophages were used in passage 8; HEKs were used in passage 4.
Cultured cells were seeded into 96-well plates at a density of 5 × 10 3 cells/well in 100 µL of culture medium. After 24 h, when cell confluence exceeded 80%, the test product (0.001%, 0.01%, 0.1%, 0.3%, 0.5%, 1%) was applied under serum-free conditions. Following incubation for 24, 48, or 72 h, the culture medium was removed, and the cells were washed with Dulbecco’s phosphate-buffered saline (DPBS). A WST substrate solution (Cell Counting Kit-8 [CCK-8]; Dojindo, Kumamoto, Japan) was prepared by mixing with culture medium at a 1:9 ratio, and 100 µL was added to each well. The plates were incubated at 37 °C for 2 h, after which absorbance was measured at 450 nm using a microplate reader (Varioskan™ LUX; Thermo Fisher Scientific).
Measured OD values were corrected by subtracting blank values, and cell viability was expressed as a percentage relative to the negative control, which was set at 100%. Higher absorbance values indicated greater numbers of viable cells.
Cells were seeded into 6-well plates at densities of 1 × 10 5 cells/well for HDFs and 5 × 10 4 cells/well for mouse macrophages and HEKn, with 2 mL of culture medium per well. After 24 h, when the 3 types of cell confluence exceeded 80%, the test products (0.3%, 0.5%, 1%) were applied in serum-free medium. For mouse macrophages, lipopolysaccharide (LPS; 1 µg/mL) was co-treated to induce an inflammatory response. L-NMMA (100 µM; Sigma-Aldrich, M7033) was used as the positive control.
After 24 h of treatment, extracellular proteins (collagen type I, collagen type III, elastin, VEGF, FGF, PDGF, TGF-β1, IL-1β, IL-6, TNF-α, and PGE-2) were collected from the culture supernatants and centrifuged at 2000× g for 10 min to remove cellular debris. The clarified supernatants were used for subsequent analyses.
For intracellular protein (HA and HAS) extraction, culture media were removed and cells were lysed with 250 µL of Pro-PREP™ Protein Extraction Solution (iNtRON Biotechnology, Gyeonggi-do, Republic of Korea). Cells were detached using a scraper, followed by centrifugation at 2000× g for 10 min, and the resulting supernatants were collected. Protein concentrations were determined using a Bicinchoninic Acid (BCA) Protein Assay Kit (Sigma-Aldrich).
ELISA was performed to quantify the production of proteins associated with anti-wrinkle efficacy—collagen type I, collagen type III, elastin, VEGF, FGF, PDGF, and TGF-β1; moisturizing efficacy—HA and HAS2; and anti-inflammatory efficacy—IL-1β, IL-6, TNF-α, and PGE-2.
Protein levels were measured in the extracted samples using commercially available ELISA kits ( Table S3 ), following the manufacturer’s instructions. Absorbance was measured using a microplate reader (Varioskan™ LUX; Thermo Fisher Scientific, Waltham, MA, USA). Protein concentrations were calculated by substituting the measured optical density (OD) values into regression equations derived from standard curves. Higher absorbance values indicated greater protein abundance.
This assay was conducted to quantify intracellular and extracellular melanin production following treatment with the test product. Mouse melanoma cells were seeded in 6-well plates at 1 × 10 5 cells/well and cultured for 24 h until >80% confluence. Cells were then stimulated with α-melanocyte-stimulating hormone (α-MSH, 100 nM; Sigma-Aldrich, M4135) and co-treated with the test product (0.1%, 0.3%, or 0.5%) in phenol red–free DMEM containing 10% FBS for 72 h.
For intracellular melanin analysis, the culture medium was removed and cells were lysed with 250 µL of 1 M NaOH containing 10% DMSO. After incubation at 60 °C for 10 min under light-protected conditions, cells were scraped and further incubated at 95 °C for 30 min. Lysates were centrifuged at 4000× g for 10 min, and the supernatants were collected. For extracellular melanin analysis, culture supernatants were centrifuged at 4000× g for 10 min, and the clarified supernatants were collected.
Absorbance of intracellular and extracellular samples was measured at 475 nm using a microplate reader (Varioskan™ LUX; Thermo Fisher Scientific). Protein concentrations were determined using a bicinchoninic acid (BCA) protein assay kit (Sigma-Aldrich), with higher absorbance values indicating increased melanin production.
Real-time PCR was performed to assess the mRNA expression of pigmentation-related genes, including MITF , TRP1 , and TYR . Mouse melanoma cells were seeded in 6-well plates at 1 × 10 5 cells/well and cultured for 24 h until >80% confluence. Cells were then stimulated with α-MSH (100 nM) and treated with the test product in DMEM supplemented with 10% fetal bovine serum for an additional 24 h.
Total RNA was extracted using TRIzol™ Reagent (Invitrogen) according to the manufacturer’s instructions. Equal amounts of RNA were reverse-transcribed into cDNA using the RNA to cDNA EcoDry™ Premix (Oligo dT) (Clontech, Mountain View, CA, USA). Quantitative PCR was performed using TaqMan™ Fast Advanced Master Mix (Applied Biosystems, Waltham, MA, USA) and gene-specific TaqMan™ probes for MITF (Mm00434954_m1), TRP1 (Mm00453201_m1), and TYR (Mm00495817_m1). The amplification protocol consisted of an initial hold step followed by 40 cycles of denaturation and annealing/extension. Gene expression levels were normalized to GAPDH (Mm99999915_g1; Applied Biosystems) and calculated using the comparative C t method. Lower C t values indicated higher transcript abundance.
Statistical analysis was performed using the IBM SPSS Statistics 27.0 program, with a significance level set at p < 0.05. Data were reported as mean ± standard deviation (SD). For within-group comparisons, one-way repeated measures ANOVA was used for data that satisfied the normality test, with within-group contrasts to identify differences between time points. For non-normally distributed data, the non-parametric Friedman test was performed, followed by a Wilcoxon signed-rank test with Bonferroni correction for post hoc analysis. For comparisons of the change from baseline between groups, we used the paired t -test for normally distributed data and the Wilcoxon signed rank test for non-normally distributed data. For comparisons of the ACSS and GAIS between groups, we used the Wilcoxon signed rank test.
In conclusion, injectable phADM showed promising clinical and biological signals suggestive of regenerative dermal remodeling in this integrated preclinical and randomized split-face clinical study. While these findings indicate potential benefits across structural, functional, and pigmentation-related parameters, the limited sample size warrants cautious interpretation. Larger, adequately powered studies are needed to validate its efficacy and durability.
声明:中文精读 · 仅供学术参考。内容来自公开文献检索,不代表本人观点,不构成诊疗建议。 医疗美容需在正规医疗机构由执业医师实施。
基于相同主题推荐 · 继续深挖
本研究为随机、分脸、双盲的前瞻性临床试验(20例成人,平均54.7岁,13例女性;韩国首尔Severance医院,2024年11月至2025年5月,注册NCT07155278),一
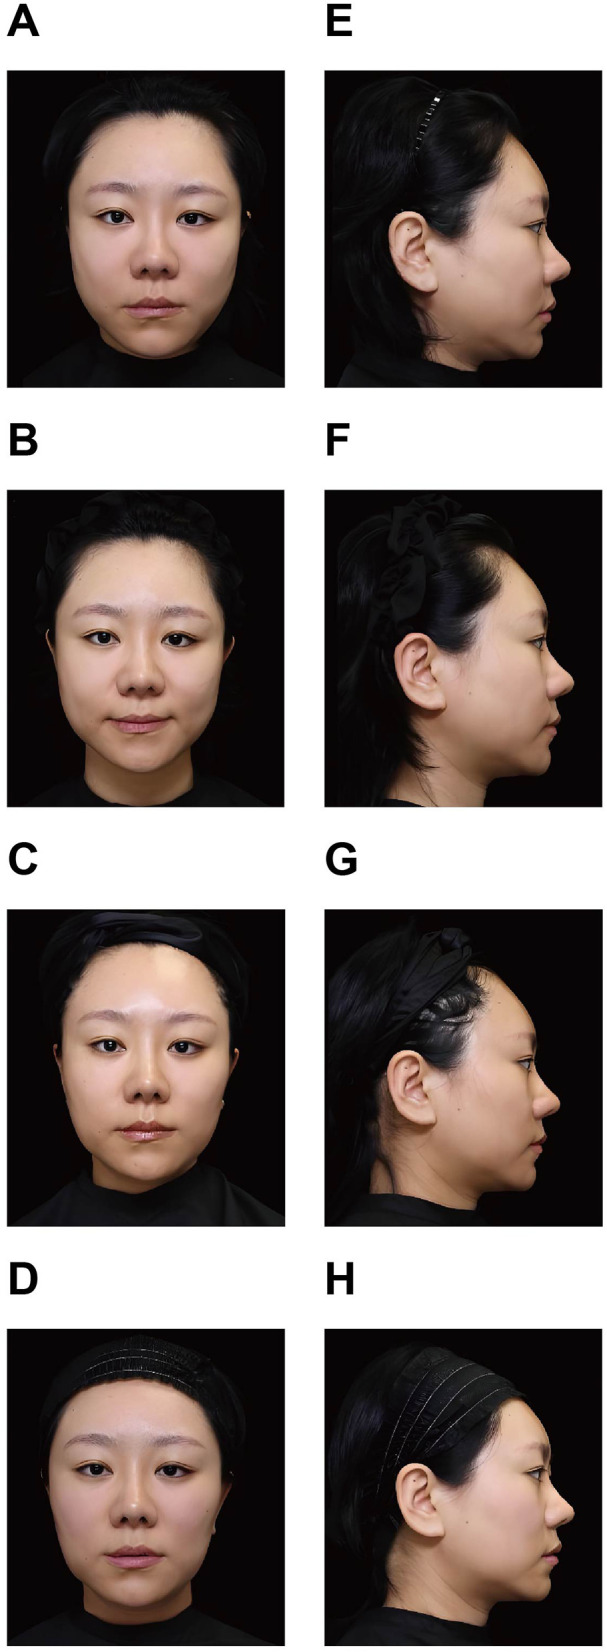
面部过度填充综合征(FOS)多由透明质酸(HA)填充剂累积或移位所致;透明质酸酶可溶解 HA,但溶解后常遗留软组织凹陷与轮廓不规则。

提出「靶区治疗分区(Target Treatment Zones, TTZ)」概念框架,为皮肤质量优先、解剖引导的分区决策工具,属 概念性临床框架,非经验证的临床指南或标准化治疗方